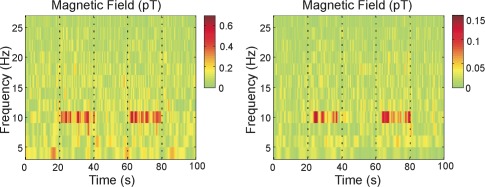
Fig. 4.
Time-frequency analysis of the CSAM signal (left) and a SQUID signal (right) obtained during a repeated sequence of 20 s of eyes open followed by 20 s of eyes closed. The eyes-closed sections start at 20 s and 60 s, lasting for 20 s as indicated, and the increase in α–power in the 10 Hz band is immediately visible both in the CSAM and the SQUID signal. Measurement position was O1, as sketched in Fig. 3 (International 10-20 system).

