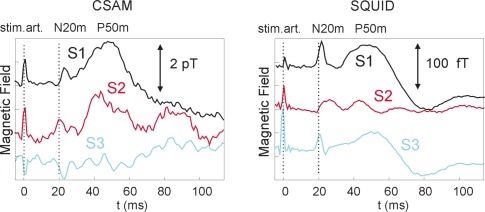
Fig. 5.
Averaged SEF for three different subjects with the CSAM and SQUID data taken sequentially over position C3 as indicated in Fig. 3. Left side: CSAM result; Right side: SQUID result. The stimulus artifact at 0 ms is visible in the curves, as are the N20m and later responses, which can vary in timing. The field strength is much smaller in the SQUID curves due to the much larger distance between source and sensor, which is estimated to be 2.5 cm for the CSAMs and 6 cm for the SQUIDs.

