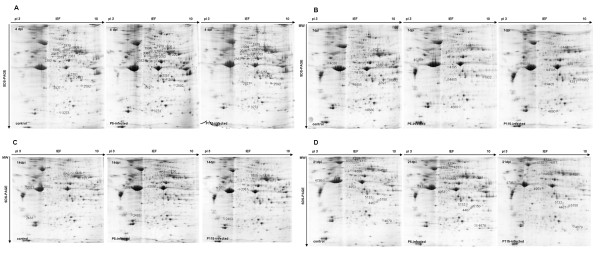
Figure 2.
Representative 2-DE maps of tracheal tissues from the IBV ck/CH/LDL/97I P5-infected group, P115-infected group and control group. (A) 4 dpi; (B) 7 dpi; (C) 14 dpi; (D) 21 dpi. Protein samples were separated on 13 cm pH 3-10 linear IPG strips, followed by SDS-PAGE, and stained with Coomassie Blue R-350. The images were analyzed using Image Master 2D Platinum 6.0 software. The differentially expressed protein spots identified were marked with circles and labeled with the respective Match ID listed in Tables 1 and 2.

