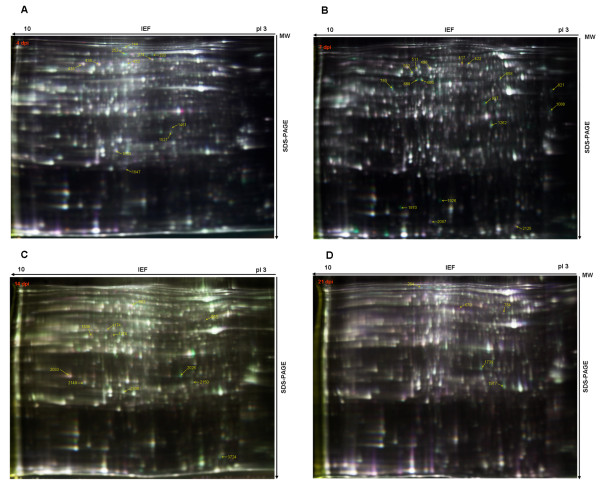
Figure 3.
Representative 2-DIGE maps of kidney tissues from the IBV ck/CH/LDL/97I P5-infected group, P115-infected group and control group. (A) 4 dpi; (B) 7 dpi; (C) 14 dpi; (D) 21 dpi. Protein samples labeled with fluor were separated on 24 cm pH 3-10 linear IPG strips, followed by SDS-PAGE, gels were scanned on a Typhoon 9400 scanner, and image analysis was performed with Ettan™ DeCyder Software version v6.5. The protein spots identified were marked with circles and labeled with the respective Match ID listed in Tables 3 and 4.

