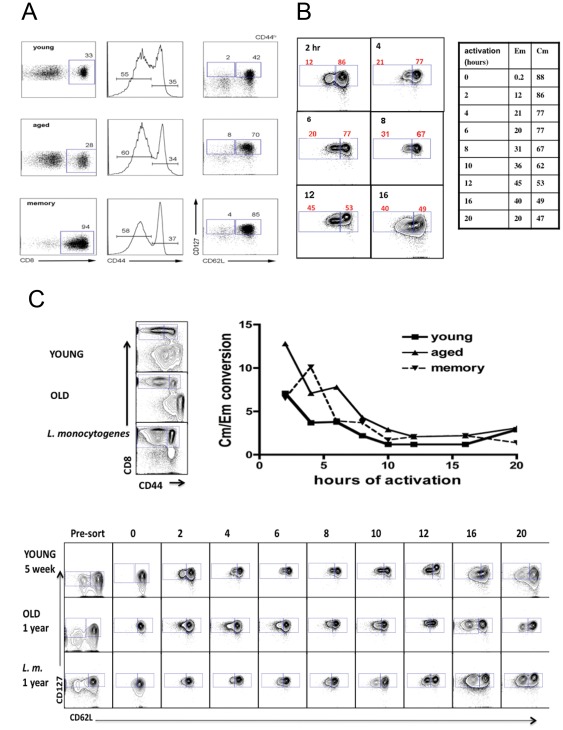
Figure 4. Conversion of Cm into Em cells upon activation in vitro.
(4a) FACS purification of spleen CD8+ CD44hiCD62LloCD127hi (Effector-memory) and CD44hiCD62LhiCD127hi (Central-memory) cells obtained from young (<5 week) and >50 week old naïve, and 50 week old mice that were previously injected with allogeneic spleen cells as indicated. Following sorting, an aliquot of cells was immediately taken for RNA isolation without activation. Analyses in the left panels are gated on CD8+ cells and show the distribution of CD44+ cells. Analyses in the right panels show Em and Cm cells within the CD44lo and CD44hi populations as indicated. (4b) Cm and Em cells were isolated by FACS from young, old, and memory (L. monocytogenes-infected) mice and activated in vitro with ConA for the indicated times before qRT-PCR. The % of CD8+CD44hi cells as CD62LloCD127hi (Em) and CD62LhiCD127hi (Cm from the ‘young’ cohort are shown in tabular form in this figure. Flow cytometry analyses of some samples from the kinetic experiment are shown to illustrate gating. (4c) Enriched CD8+ spleen cells prior to sorting are shown in the left panels. After labeling Cm were isolated and activated in vitro. The recovery of Em and Cm cells was determined by flow cytometry after re-staining and flow cytometric analysis. Shown are the FACS analyses after the indicated times of Cm activation. Also shown is the number of Cm and Em cells derived from in vitro activation of Cm cells represented as a ratio of Cm to Em cells at the various times of analyses.

