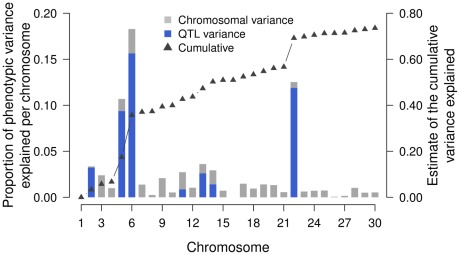
Figure 4. Chromosomal partitioning of the phenotypic variance.
The grey and blue bars indicate the fraction of phenotypic variance attributed to a particular chromosome and QTL region, respectively. The triangles represent the cumulative proportion of phenotypic variance attributable to the 30 chromosomes.

