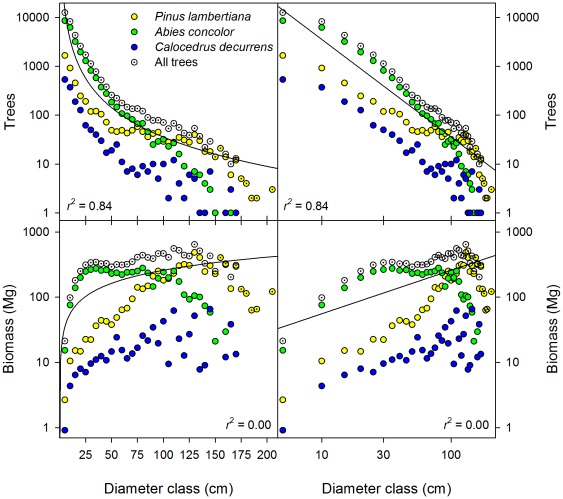
Figure 2. Diameter distribution of the number of trees and the biomass of trees in the Yosemite Forest Dynamics Plot.
Each point represents a 5 cm diameter class (first bin; 1 cm≤dbh<5 cm) of the trees from the entire 25.6 ha plot (34,458 live stems ≥1 cm dbh totaling 12,897 Mg); identical data are shown with linear diameter bins (left) and log diameter (right). Solid lines represent the best fitting equation of the form specified by scaling theory,  (r2 = 0.84) and
  (r2 = 0.00), where r is tree radius.

