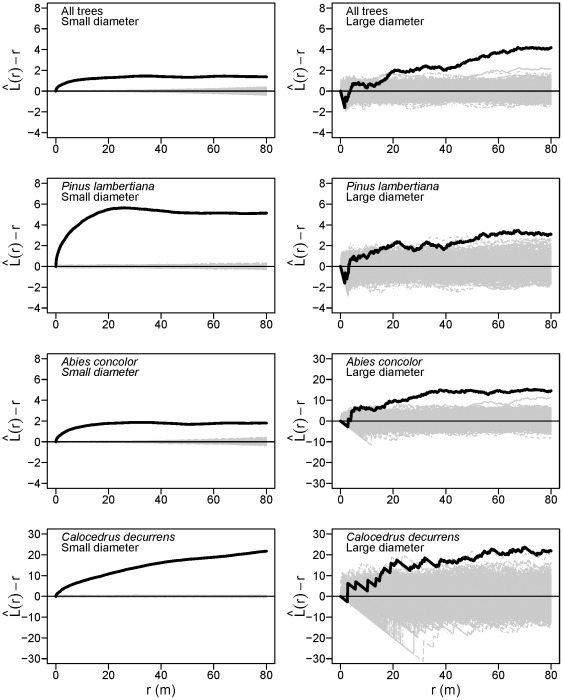
Figure 4. Univariate tree spatial patterns in the Yosemite Forest Dynamics Plot.
Solid black lines show the  statistic for the actual patterns, where r is the intertree distance; thin gray lines show
  curves for 999 simulations of complete spatial randomness. Positive values indicate spatial clumping and negative values indicate spatial regularity. Large-diameter trees are ≥100 cm dbh; small-diameter trees are <100 cm dbh.

