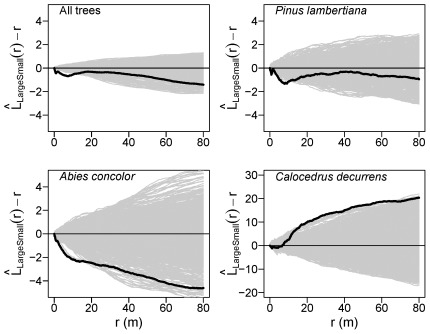
Figure 5. Spatial interactions between large-diameter and small-diameter trees.
Solid black lines show the  statistic for the actual pattern, where r is the intertree distance; thin gray lines show
  curves for 999 patterns simulated by synchronous random torodial shifts of large and small tree subpopulations. Positive values indicate spatial attraction and negative values indicate spatial repulsion. Large-diameter trees are ≥100 cm dbh; small-diameter trees are <100 cm dbh.

