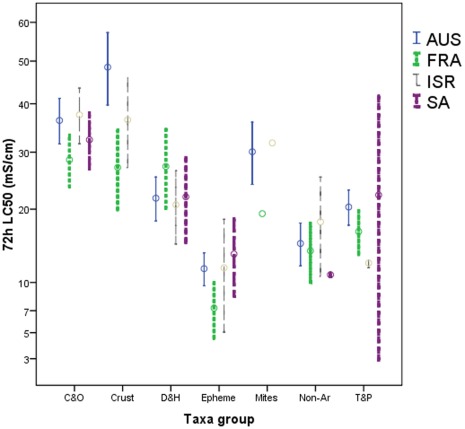
Figure 4. Mean ±2 standard errors (on both sides of the mean) of non-censored 72 h LC50 values for selected taxa groups in the four regions.
Where C&O = Coleoptera and Odonata, Crust = Crustaceans, D&H = Diptera and Hemiptera, Epheme = phemeroptera, Mites = Hydracarina, Non-Ar = non-arthropods, T&P = Trichoptera and Plecoptera.

