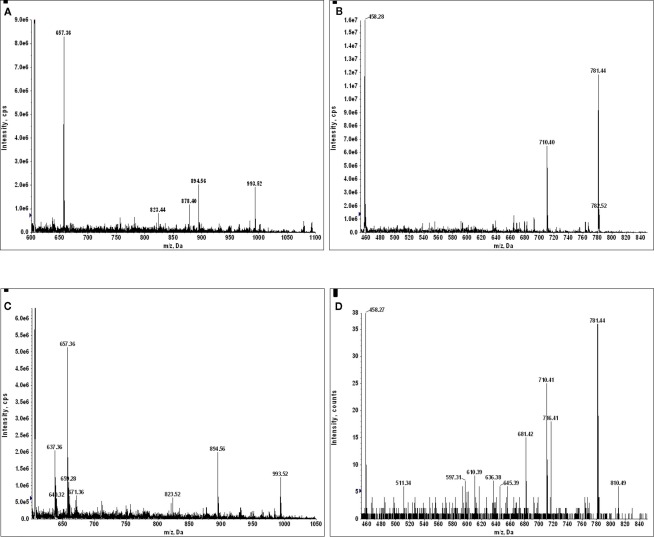
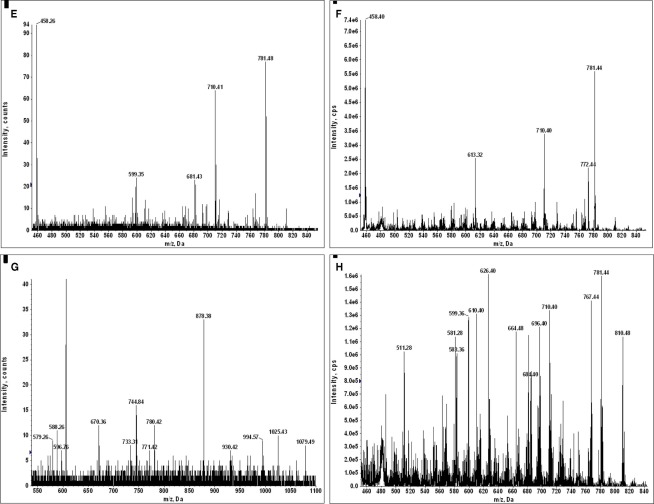
Figure A13.
(A) MS2 605.8 of sample KTS1; (B) MS2 449.8 of sample KTS2; (C) MS2 605.8 of sample KTS4; (D) MS2 449.8 of sample KTS5; (E) MS2 449.8 of sample KTS6; (F) MS2 449.8 of sample KTS7; (G) MS2 605.8 of sample KTS8; (H) MS2 449.8 of sample KTS9. Only in the MS2 spectra of (G,H) can one not recognize the dissociation spectrum of a GILT signal peptide.


