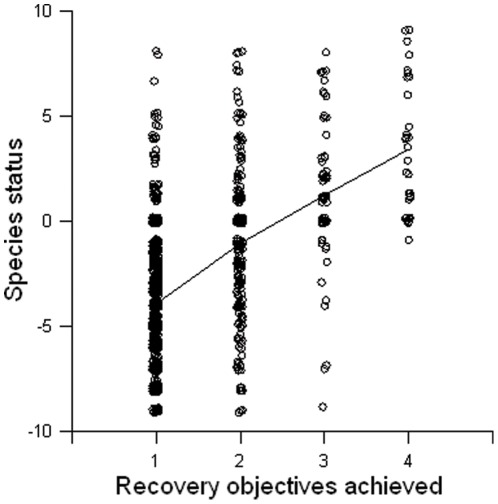
Figure 4. Relationship between population status and recovery objectives achieved.
Scatter plot showing the relationship between change in population status over time and recovery objectives achieved for ESA listed species. Data comes from biennial FWS recovery reports to Congress. Line shows LOWESS smoothing functions with tension = 0.7. N = 1179.

