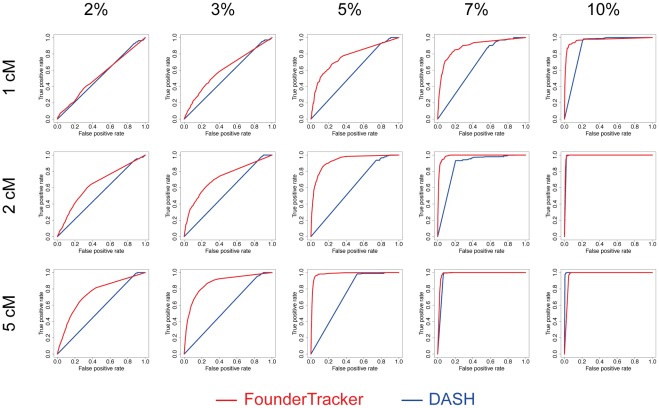
Figure 6. Power analysis with simulated data.
The performance of FounderTracker was assessed under various conditions, by comparison with the DASH method. The ability of each method to detect conserved haplotypes was established as a function of haplotype length (1 to 5 cM) and prevalence (2 to 10% of the samples). For each condition, the mean ROC curve was established by applying each method to 100 simulated datasets.

