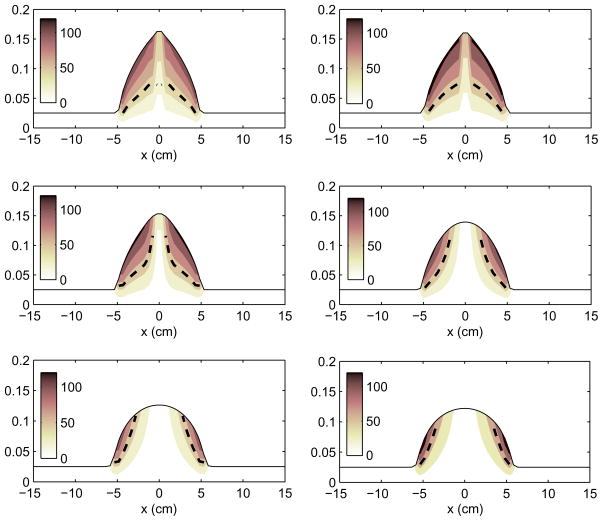
Fig. 5.
Contour plots of the shear stresses (Pa) along the channel (cm) at 10 s, 1, 5, 30, 90, and 120 min (from left-to-right, top-to-bottom). Yield surfaces, Eq. (7), are plotted as dashed lines. The un-yielded zone occurs below the dashed line, while the yielded region is located between the dashed line and the surface of the bolus (solid line). Note that dashed lines are exaggerated. In reality, they are simply lines of infinitesimal thickness, and represent the interface between the yielded and the un-yielded regions.

