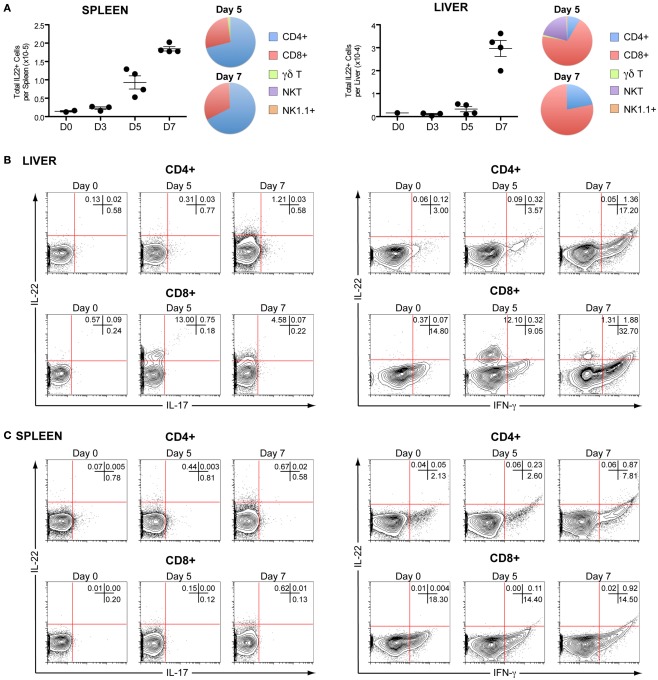
Figure 4.
In vivo kinetics of IL-22 in spleen and liver of mice infected with P. chabaudi. C57BL/6 mice were infected with 105P. chabaudi and sacrificed at days 3, 5, and 7 post-infection. (A) Total numbers of IL-22+ cells in splenocytes and hepatocytes from naïve and infected C57BL/6 mice. The fraction of CD4+, CD8+, γδ+, NK T cells, and NK cells contributing to IL-22 production in infected splenocytes and mononuclear liver cells on days 5 and 7 post-infection. The numbers represent the median and range of four mice. Representative flow cytometry plots of IL-22 versus IL-17A (left panels) and IL-22 versus IFN-γ (right panels) and expression in CD4+, and CD8+ T in naïve, day 5 and 7 infected liver mononuclear cells (B) and splenocytes (C). Numbers in quadrants refer to the percentages of cells in each quadrant. Data are representative of two experiments and are from groups of four mice per time point.

