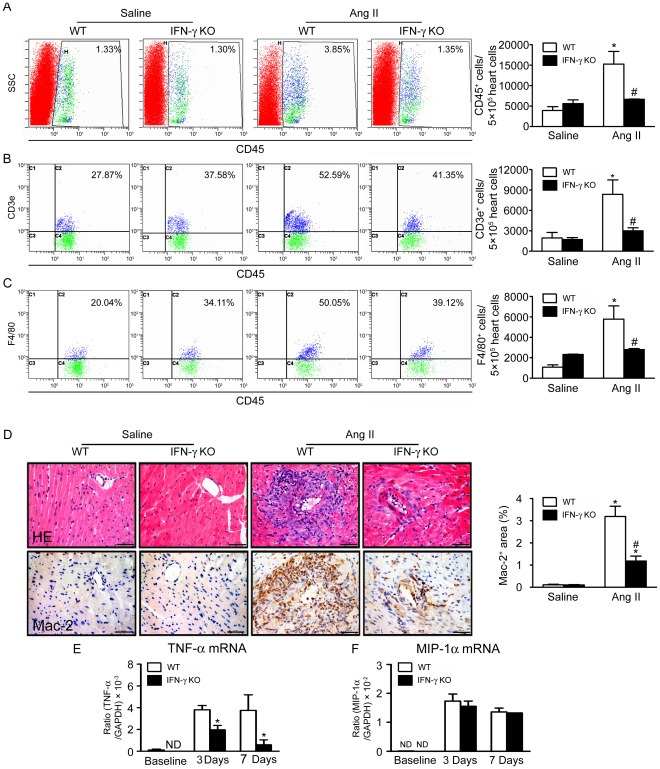
Figure 3. Knockout of IFN-γ suppresses Ang II infusion-induced inflammatory cells infiltration and cytokines expression in hearts.
A–C, Flow cytometry analysis of (A) CD45+, (B) CD3e+, (C) F4/80+ cells infiltration in Ang II-treated WT and IFN-γ-KO hearts. Bar graph shows quantification of different inflammatory cells in hearts (n = 5). D, Immunohistochemistry of expression of Mac-2 in WT and IFN-γ-KO hearts with saline or Ang II treatment: hematoxylin and eosin (HE) staining (top panel) and antibodies against Mac-2 (bottom panel). Bar graph shows quantification of areas of Mac-2+ cells. Magnification: ×200. E–F, Real-time PCR analysis of (E) tumor necrosis factor (TNF)-α Mrna and (F) macrophage inflammatory protein (MIP)-1α expression in both WT and IFN-γ KO mice at baseline and day 3, day 7 after Ang II infusion. Data are mean ± SEM (n = 5). * p<0.05, ** p<0.01 versus saline control; # p<0.05 versus Ang II-infused WT mice.

