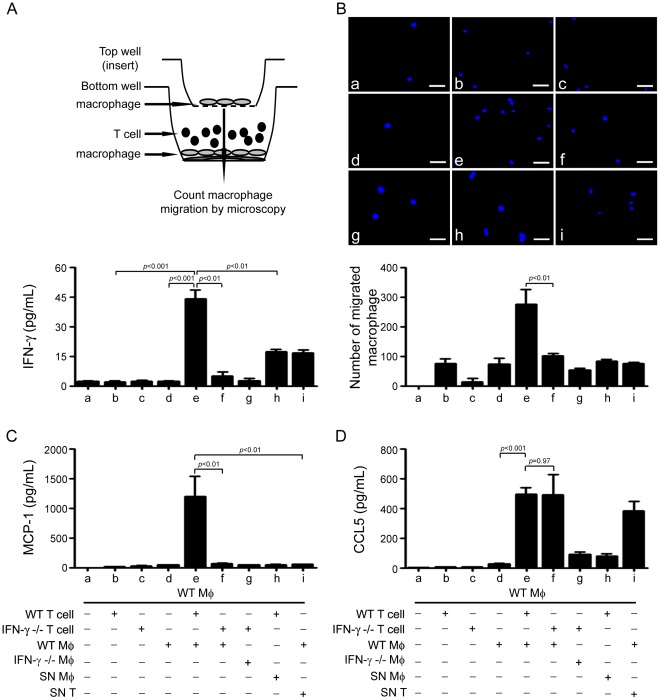
Figure 5. Crosstalk between IFN-γ-producing T cells and macrophages augments IFN-γ and MCP-1 expression and macrophage migration.
A, IFN-γ expression was determined by incubating T cells either with macrophages isolated from and WT or IFN-γ-KO mice or with the supernatant of macrophages. Bar graph represents the quantification of IFN-γ level in the supernatant of the cell culture. B, Transwell assay of macrophages migration. WT macrophages were plated on the upper chambers of transwell inserts. The lower chamber was consisted of co-cultured WT or IFN-γ-KO T cells with WT macrophage (as described in A, upper panel). Macrophages that had migrated to the lower chamber were counted by DAPI staining. Bar graph represents the cell numbers that migrated into the lower chamber. C–D, Quantification of (C) MCP-1 or (D) CCL5 levels in the supernatant of the cell cultures as described in A. * p<0.05, **p<0.01 versus co-culture of IFN-γ-KO T cells with WT macrophages. Mφ, macrophage.

