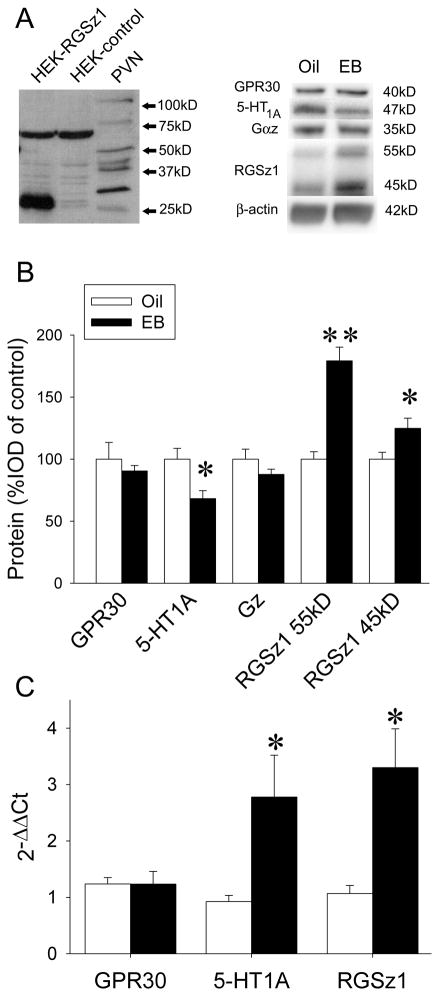
Figure 2.
EB-induced changes in 5-HT1A signaling pathway. A) Left, characterization of RGSz1 antibody. RGSz1 protein at approximately 27kD was detected in HEK293 cells transfected with a vector expressing RGSz1 protein but not empty-vector transfected cells. In rat PVN, higher molecular weight proteins were also detected most likely due to post-translational modifications. Lane 1, HEK293 cells transfected with RGSz1. Lane 2, HEK293 cells transfected with empty vector (pcDNA). Lane 3, PVN tissue lysate. Right, Western blot of PVN protein after oil or EB treatment with antibodies against GPR30, 5-HT1A, Gαz, and RGSz1, with β-actin as a loading control. B) Quantitation of protein levels after EB pretreatment. Bands were analyzed densitometrically (integrated optical density, IOD). Each band was normalized to β-actin and expressed as percent of control (oil). Data are expressed as mean ± SEM (n=6), *p<0.05, **p<0.001 by Student-Newman-Keuls post hoc test. C) qPCR of mRNA isolated from PVN tissue, normalized to control (oil). ΔCt was calculated as the target gene – TBP mRNA for each sample; ΔΔCt was calculated as ΔCt for the experimental condition − ΔCt for the control condition, for each target gene. Changes in mRNA levels are expressed as mean 2−ΔΔCt ± SEM (n=4–6), *p<0.05 by Student-Newman-Keuls post hoc test.

