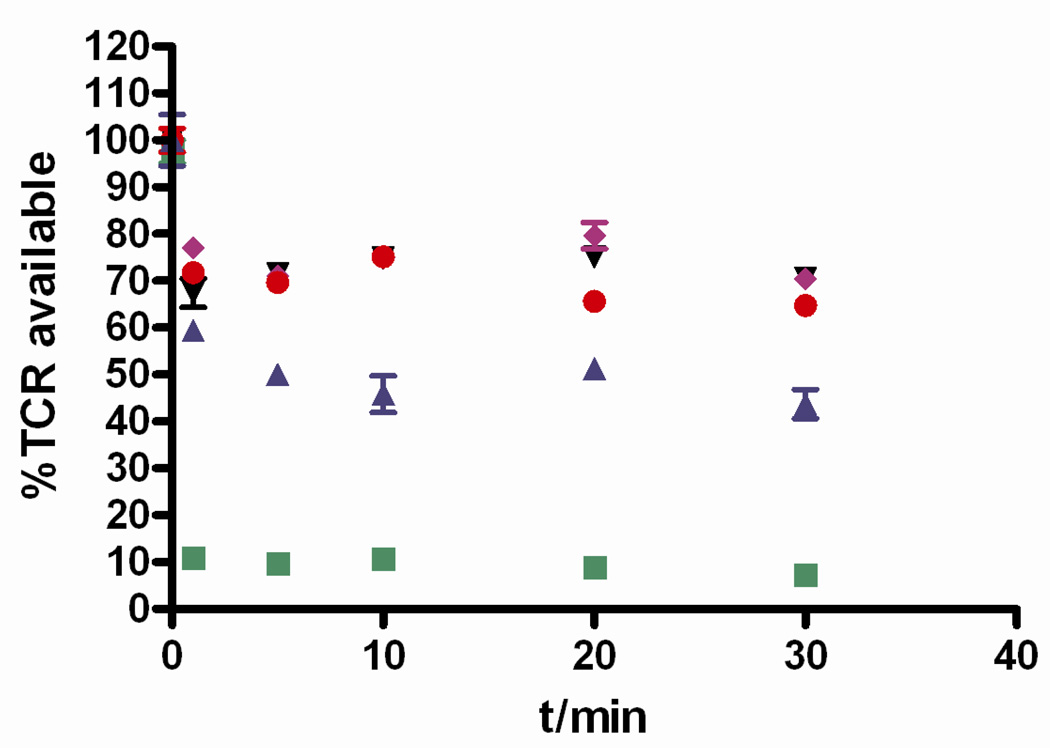
Figure 11.
TCR modulation induced by a panel of anti-CD3 (monovalent 1DDantiCD3: black downward triangles; divalent CSANs: purple diamonds; octavalent CSANs: red dots; divalent UCHT-1 F(ab')2: blue upward triangles; and mAb anti-CD3 UCHT-1: green squares). PBMCs were treated with indicated anti-CD3 for 1, 5, 10, 20, and 30 min, and T cell receptors on cell surface were then stained with FITC-anti-human αβTCR. TCR modulation was analyzed by flow cytometry. %TCR available represents percentage of TCR on cell surface treated with anti-CD3 as a fraction of surface TCR on control cells.

