Figure 3.
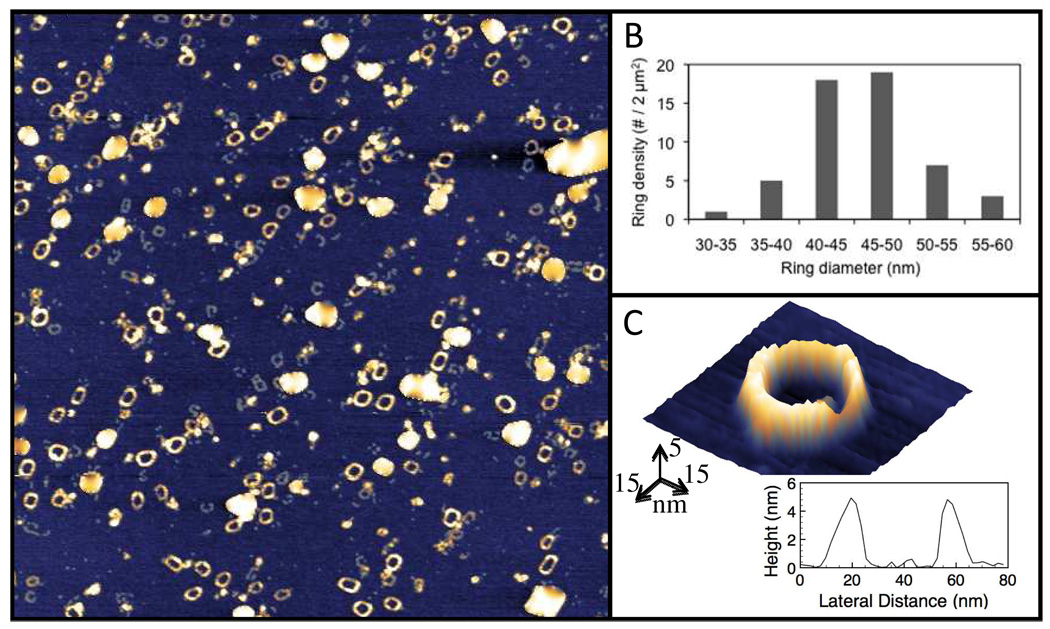
Characterization of octavalent anti-CD3 CSANs (1DDantiCD3 octamer) formation by Atomic Force Microscopy. (A) 2 µm × 2 µm AFM topograph showing homodispersed octavalent CSANs on a prepared atomically flat mica surface. Maximum height (white) is 5 nm. (B) Quantification of 55 individual ring diameters using 5 nm binning, showing the average ring sizes to exist as ~40–50 nm across. (C) Pseudo-3D representation of an individual nanoring, showing a peak-to-peak diameter of 45 nm. Large white particles in A are salt crystals, artifacts due to the short sample rinse time required to keep the nanorings on the surface for study.

