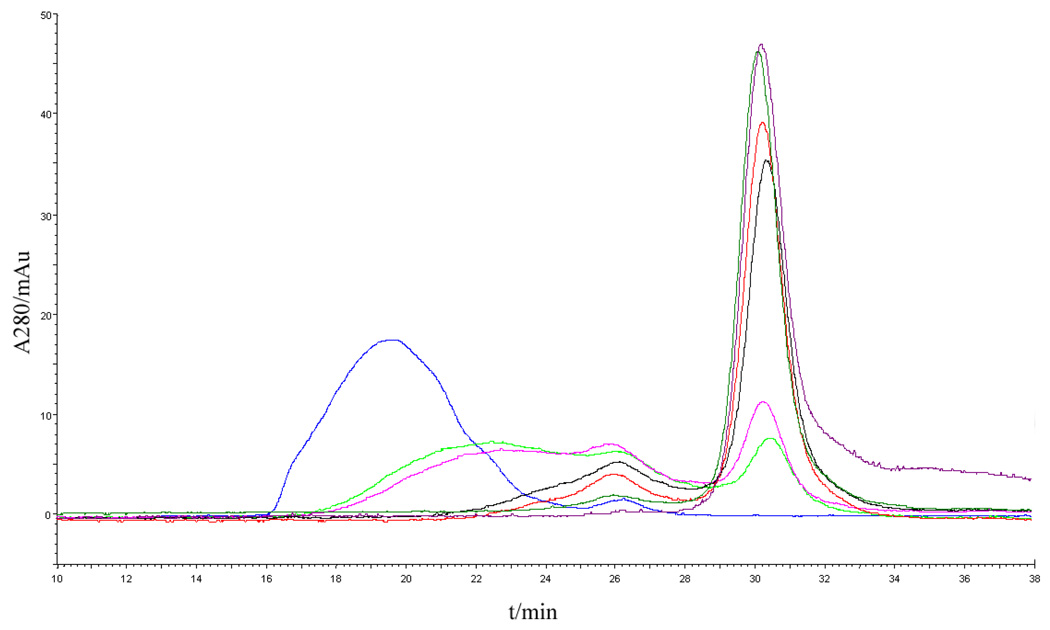
Figure 4.
Characterization of induced octavalent anti-CD3 CSANs disassembly with methotrexate by Size-Exclusion Chromatography. Blue curve: CSANs; light green, pink, black, red, dark green, and purple curves: disassembled oligomers after incubation with methotrexate for 5, 20, 40, 80, 150, and 240 min, respectively.

