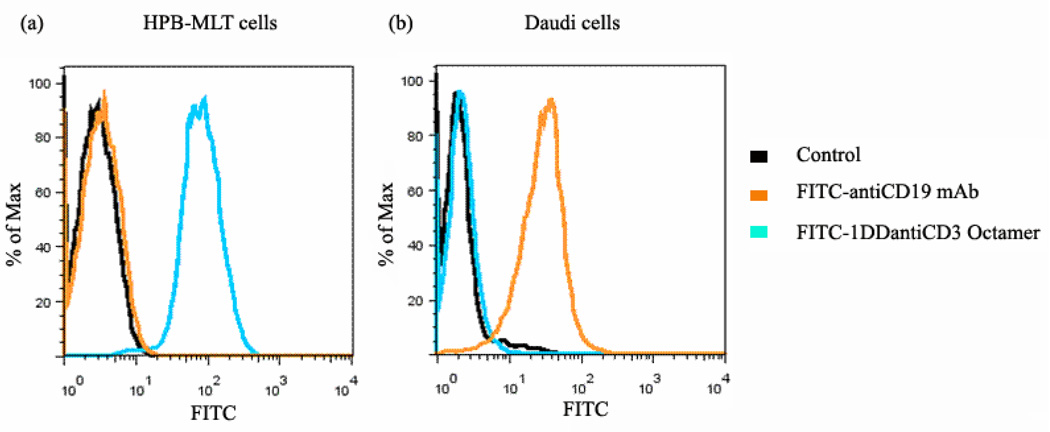
Figure 6.
FITC-octavalent anti-CD3 CSANs bound to CD3+ HPB-MLT cells (a) but not to CD3- Daudi cells (b). HPB-MLT cells or Daudi cells were incubated with FITC-antiCD19 mAb or FITC-octavalent anti-CD3 CSANs at 37°C for 30 mins. FITC-antiCD19 mAb was used as positive control bound to Daudi cells. The fluorescence of bound FITC-antiCD19 mAb or FITC- octavalent anti-CD3 CSANs was analyzed by flow cytometry. The horizontal axis of the diagram represents the fluorescent intensity, and the vertical axis shows the percentage of maximum cell number.

