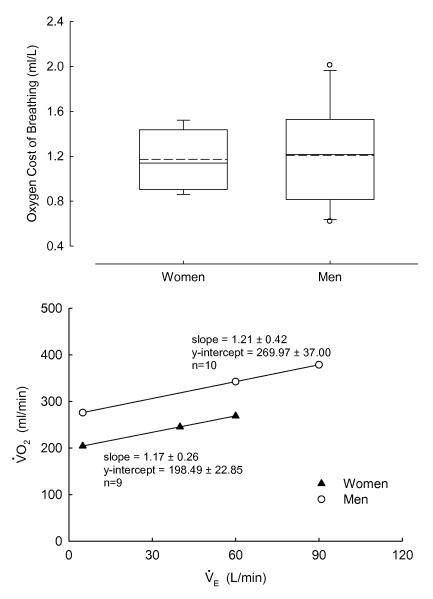
Figure 1.
Top panel: Box-plots of the oxygen cost of breathing during eucapnic voluntary hyperpnea (EVH). Boundary of the box closest to zero denotes 25th percentile, solid line within the box denotes median, dashed line denotes mean, and the boundary of the box farthest from zero denotes 75th percentile. Error bars above and below the box denote 10th and 90th percentiles. Outliers are denoted by open circles. Bottom panel: Mean and values during the EVH. There was no difference in the oxygen cost of breathing (i.e. slope) between the nonobese women and men over the ventilatory ranges studied.

