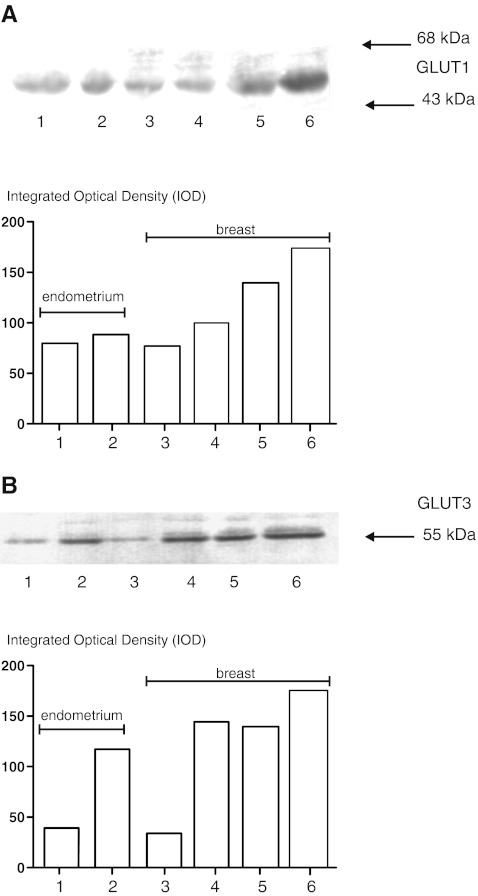
Fig. 1.
A representative results of GLUT1 a and GLUT3 b protein expression analyses in homogenates of endometrial and breast carcinomas. Lower panels show the results of quantitative densitometric analysis. a and b lane 1- normal endometrium, lane 2—endometrial carcinoma, lane 3—normal breast tissue, lanes 4–6—breast cancer samples classified according the Bloom and Richardson grading system as I, II, III, respectively

