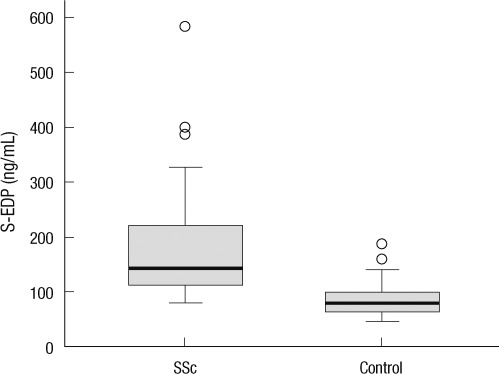
Fig. 1.
Serum concentrations of S-EDP in SSc patients. Serum concentrations of S-EDP in SSc patients were significantly higher than those in healthy controls (P < 0.001, by Mann-Whitney U test). The thick horizontal lines in boxes are medians and the upper and lower sides of the boxes represent upper and lower quartiles, respectively. The horizontal bars above and below each box represent highest and lowest values within the 1.5 times of interquartile range and circles represent outliers.

