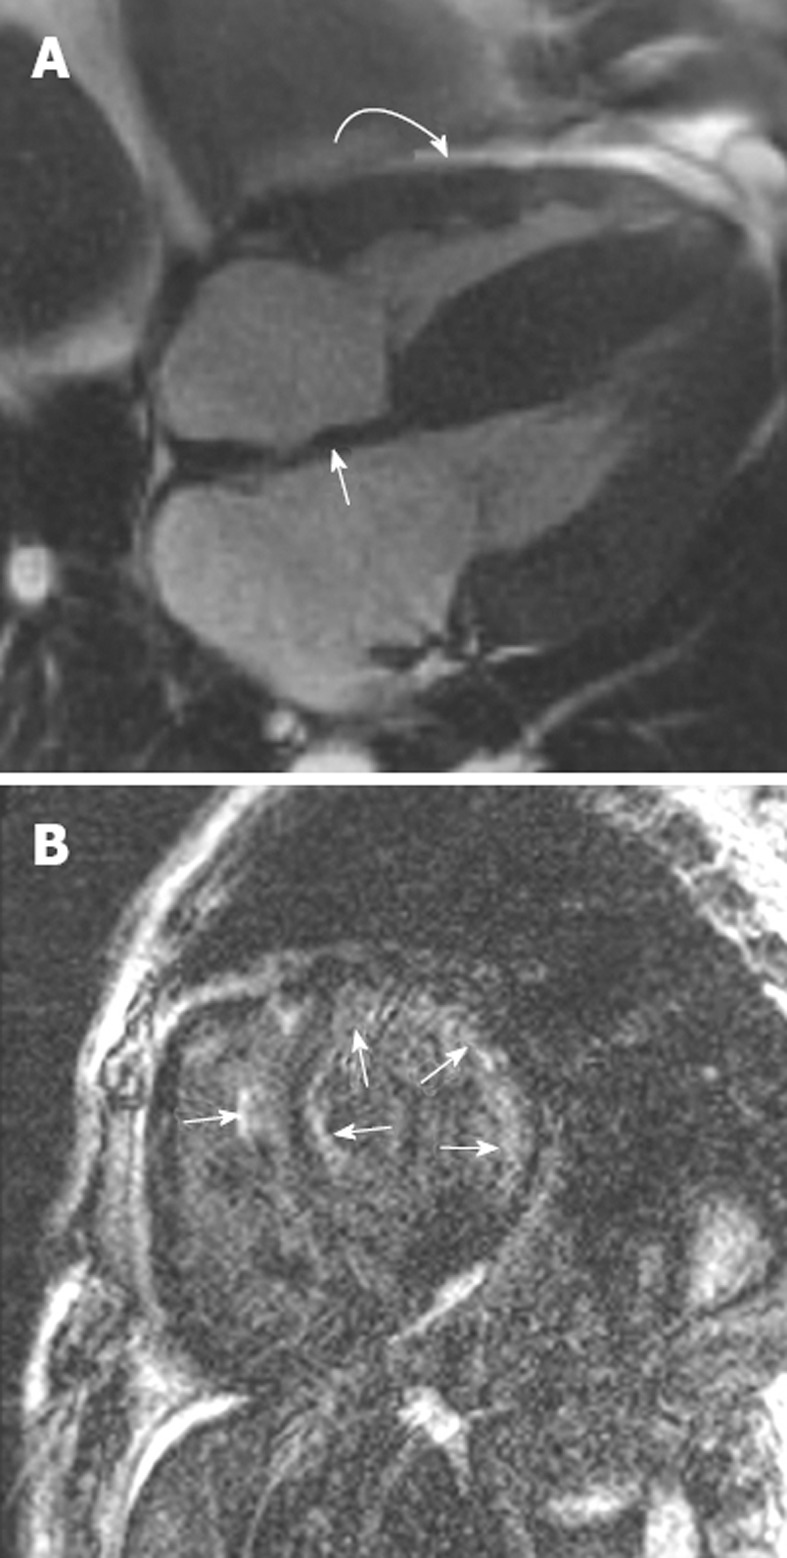
Figure 5.

Right ventricular endomyocardial biopsy showed cardiac amyloid. A: Horizontal long axis steady-state free precession sequence showing hypertrophy of the basal segments of the left ventricle (straight arrow), and bi-atrial enlargement and thickening of the interatrial septum (curved arrow). Note the small pericardial effusion; B: Late-enhanced sequence shows a circumferential subendocardial high signal. Note the high signal on the right ventricular side of the interventricular septum resulting in the tram track sign (arrow). Note also the small pericardial effusion.
