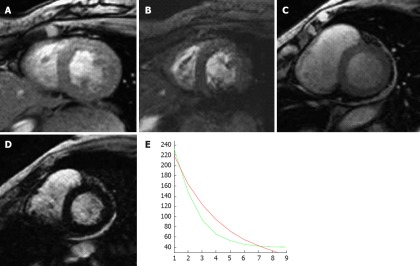
Figure 6.
A 79-year-old woman with myelodysplasia treated with blood transfusions over many years. A (echo time 10 ms) and B (echo time 20 ms) are two short axis T2star sequences from a normal patient with no evidence of myocardial iron overload; C (echo time 10 ms) and D (echo time 20 ms) are from the patient with myelodysplasia showing a progressive loss of signal with increasing T2 echo time indicating shortened T1 relation secondary to iron infiltration; E: Graph of decreasing T1 relaxation times (green line) compared with a normal patient (red line).

