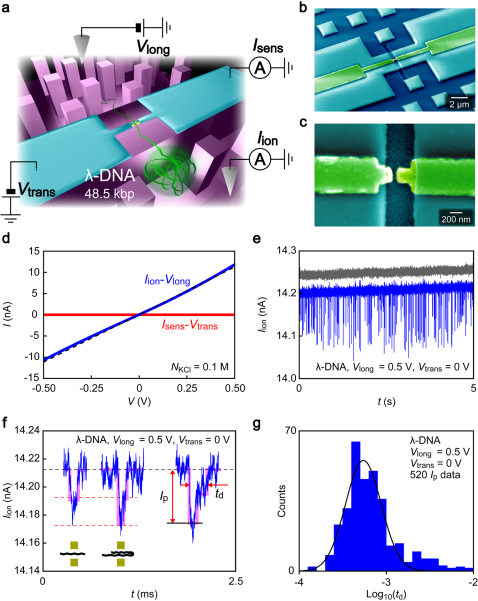
Figure 1. Electrical detection of DNA translocation in an electrode-embedded nanochannel sensor.
(a) Schematic illustration of an electrode-embedded nanochannel used for single-molecule detection of DNA translocation. 48.5 kbp λ-DNA dissolved in a KCl solution is electrophoretically drawn through the electrode channel. Meanwhile, the trans-channel ionic current blockade Iion and the transverse current Isens were measured simultaneously. (b) A false-colored scanning electron micrograph of the nanochannel sensor. A pair of nanoelectrodes (yellow) is used to apply a transverse field. Micropillar arrays at both sides of the electrode channel were used as a spacer for avoiding roof collapse upon channel sealing with a PDMS block. (c) A magnified view of the nanochannel/electrode structure. The electrode gap of size 50 nm × 60 nm × 200 nm (width × height × length) defines the fluidic channel dimension. (d) Ionic conductance of the electrode channel. The trans-channel ion current Iion measured in 0.1 M KCl solution increases nearly linearly with the driving voltage Vlong (blue plots), from which we obtained the channel conductance of 20 nS. The dotted line is the theoretical drift current flowing through the 50 nm channel. (e) A Iion trace acquired at a sampling rate of 1 MHz in a 10 nM λ-DNA solution under a driving voltage of Vlong = 0.5 V with no transverse field Vtrans (blue curve). Downward spike-like signals signify current blockade by polynucleotides passing through the electrode channel. Such characteristic current spikes were not observed in the control experiments conducted for the salt solution with no DNA added (gray curve). (f) A close view of a current spike, which is characterized by the magnitude of current blockade Ip and the translocation duration td. The black and red dotted lines denote the base level current and the characteristic blockade current of n × 14 pA (n = 1, 2) that correspond to translocation of (n - 1)-folded DNA, respectively. The purple lines are guide to the eyes for the current steps. (g) The distribution of td shown in logarithmic scale. The solid line is a Gaussian peak fitted to the histogram.

