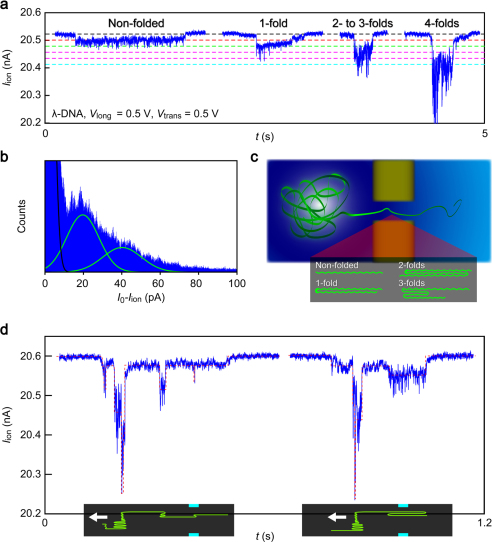
Figure 4. Real time electrical identification of local folds in a single-molecule DNA.
(a) Magnified views of long events with plateaus at 20 pA × n (n = 1, 2, 3 ···) that correspond to translocation of DNA with n-folds through the channel. (b) A current histogram constructed with the Iion trace. The background current I0 is subtracted from Iion. Black line is a fit to the pronounced peak at 0 A that originates from the base level current with 10 pA noise. Green lines are the Gaussian fits to the two peaks observed at 20 pA and 41 pA. These current states are attributed to ion blockade by non- and single-folded DNA in the channel. (c) Schematic illustration depicting translocation of DNA having some folds. (d) Examples of identification of local folds in an individual DNA by the Iion landscape. The schematic models describe DNA topologies assessed from the Iion profiles. Red dotted lines are guide to the eyes for Iion steps at integer multiples of 20 pA. White arrows indicate direction of DNA flow through a nanochannel.

