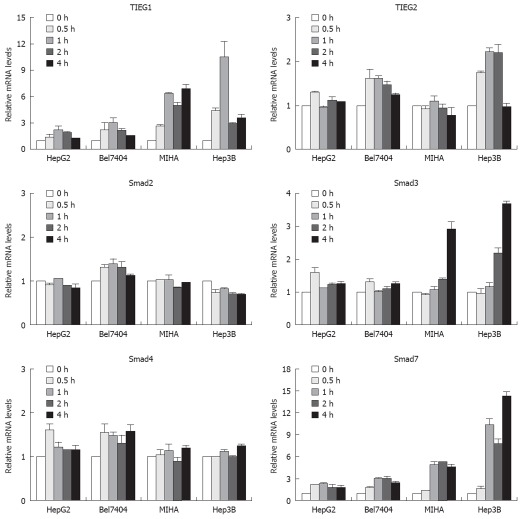
Figure 2.
Differential responses of TIEGs and Smads in various TGF-β1-treated cells. Cells were treated with 5 ng/mL TGF-β1 for up to 4 h. At indicated time intervals, the mRNA levels of TIEG1, TIEG2, Smad2, Smad3, Smad4, and Smad7 were determined by quantitative real-time RT-PCRs. Data were presented as mRNA levels relative to that of time 0 from three independent experiments.

