
Figure 1.
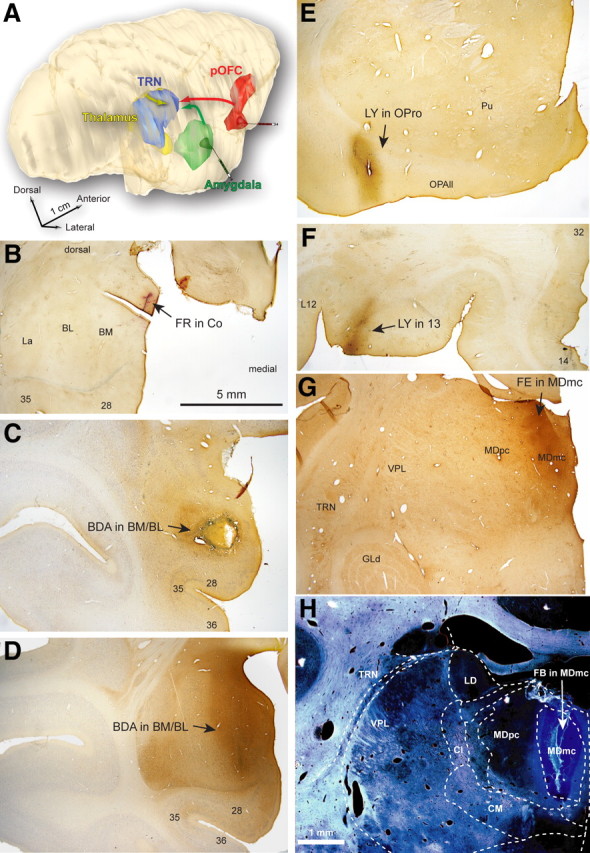
Experimental design and representative tracer injections. A, Bidirectional tracers were injected in the amygdala (green), pOFC (red), and MD (yellow) to study the distribution and overlap of pathways terminating in TRN (blue). The 3D reconstruction of a rhesus monkey brain from serial sections shows the relative position of areas included in the study. B–H, Low-magnification bright-field images of sites injected with neural tracers in amygdalar nuclei (Co, BM, and BL; B–D), orbitofrontal cortex (area OPro, orbitofrontal area 13; E, F), and in the MDmc (G, H) (Table 1). Areas: 28, entorhinal area 28; 35, perirhinal area 35; 36, perirhinal area 36. Cl, Centrolateral nucleus; CM, centromedian nucleus; GLd, dorsal–lateral geniculate nucleus; LD, lateral–dorsal nucleus; OPAII, orbital periallocortex; Pu, putamen; VPL, ventral–posterior–lateral nucleus. Scale bars: (in B) B–F, 5 mm; (in H) G, H, 1 mm.