
Figure 2.
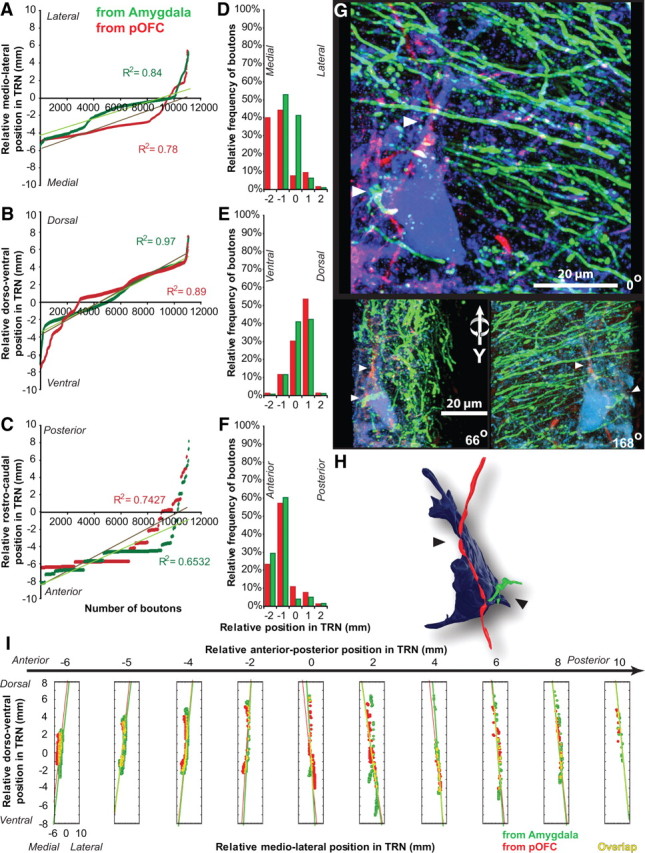
Overlap of pOFC and amygdalar pathways in TRN. A–C, Relative position of labeled terminals from the amygdala (green) and pOFC (red) in the mediolateral (A), dorsoventral (B), and anteroposterior (C) axes of TRN; linear fits show similarities in the distribution of the two pathways. D–F, Relative proportions of labeled terminals from the amygdala (green) and pOFC (red) in the mediolateral (D), dorsoventral (E), and anteroposterior (F) axes of TRN show similarities in frequency distribution. G, 3D-projected confocal stack, rotated on the y-axis, shows closely apposed amygdalar (green) and pOFC (red) terminals onto the same TRN neuron (blue). White arrowheads indicate some likely sites of contact. H, Closely apposed terminals on TRN neuron reconstructed from G. Black arrowheads indicate likely sites of contact. I, Composite 3D plot collapsed into two dimensions shows the distribution and overlap (yellow) of labeled terminals from the amygdala (green) and pOFC (red). Each box represents a specific anteroposterior relative coordinate. The y-axis of each box indicates relative dorsoventral coordinates; the x-axis of each box indicates the relative mediolateral coordinates in TRN.