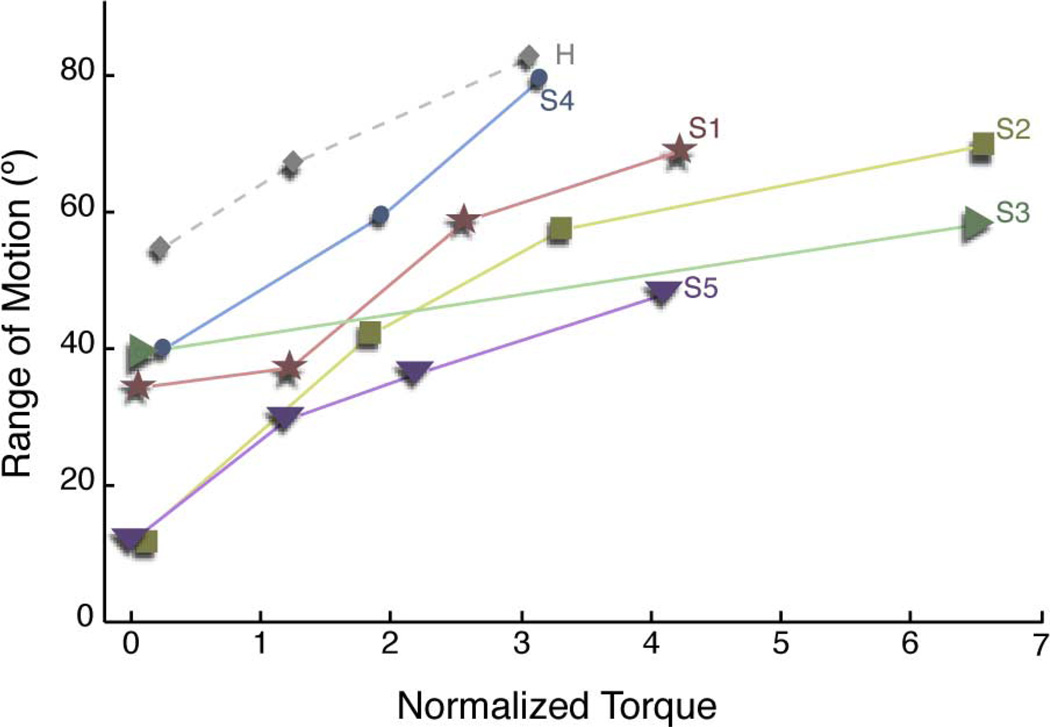
Fig. 9.
For all stroke subjects, knee flexion assistance increased range of motion. Labels on plot correspond to subject data in Table II. Each data point represents the average peak parameters of about 20 steps. Since each step taken causally affects the following step, observations of peak gait parameters are not independent, and variability such as standard deviation is not useful. Therefore, only averages are given.

