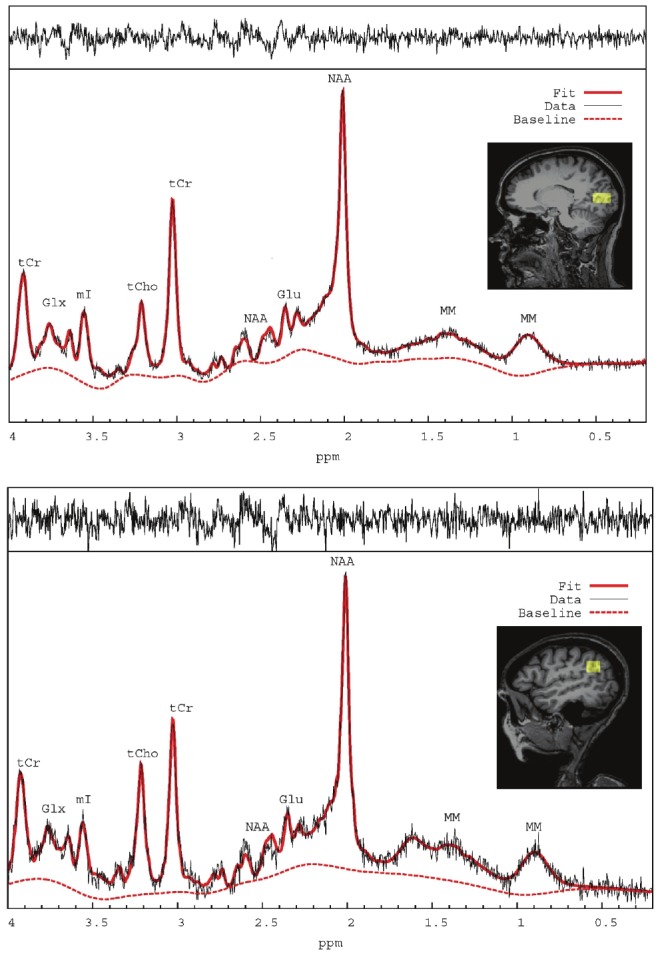
Figure 1.

Localized 1HMRS spectra processed by LCModel software from the occipital cortex (top) and parietal cortex (bottom) with the appropriate locations in parietal and occipital cortex shown on corresponding T1-weighted MR images. Labeling of the spectral signatures for glutamate (Glu), N-Acetyl-Asparate (NAA), Glutamate + Glutamine = GLX, total choline (tCho), total creatine (tCr), myo-inositol (mI) and macromolecules (MM). The raw (black) and fitted (solid red line) spectrum as well as the remaining baseline (stippled red line) are shown in each of the spectra.
