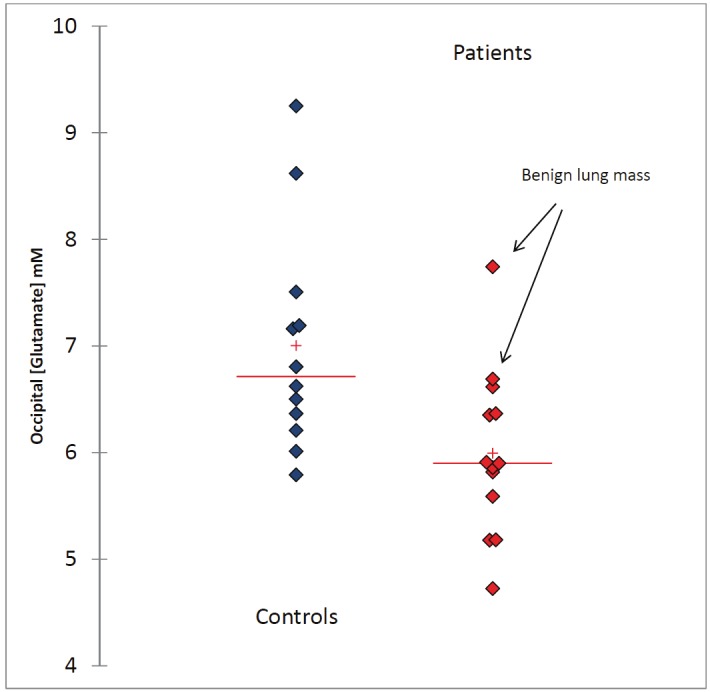
Figure 2.

The scattergram shows occipital [Glu] from individual subjects in the control and patient groups and demonstrates that the mean concentration of [Glu] in the patients is lower compared to controls. The arrows point to two patients with the highest levels of [Glu] who were both found to have benign lung lesions.
