
Figure 3.
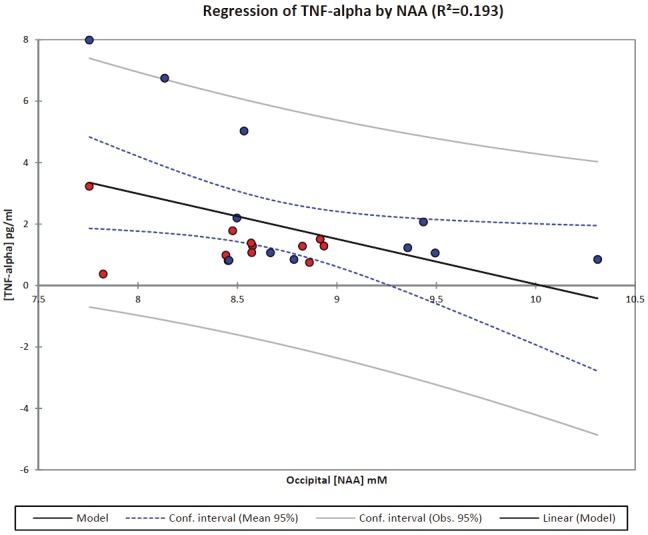
A multiple regression analysis was performed on [TNF-α] of all subjects (both patients and controls) using all metabolites in occipital cortex. A stepwise selection was used to select the significant metabolites in relation to the magnitude of the inflammatory response. After stepwise selection a significant relation between [NAA] and [TNF-α] was found. The model derived was as follows: [TNF-α] = 15 - 1.5*[NAA] (R2=0.193; p=0.036); indicating that an elevated [TNF-α] will decrease occipital [NAA]. The patients and controls are marked by a red and blue circle, respectively.