
Figure 1.
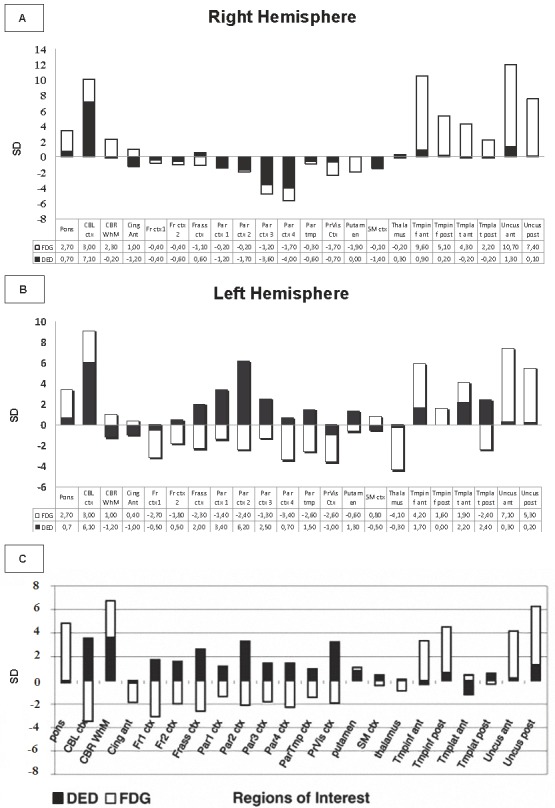
A, BA: Right hemisphere. B: Left hemisphere: Stacked bar graphs showing the mean FDG and DED change from normal (in standard deviations) for each ROI in the patient with CJD in the right and left hemispheres. FDG values are normalized to the whole brain for FDG. Standard Deviations of expected slope values were used. C: Bar graph showing the DED/FDG ratio in the mentioned areas in patients with CJD [9]. Ant, anterior; inf, inferior; post, posterior; ctx, cortex; CBL, cerebellum; CBR WhM, cerebral white matter; Cing, cingulum; Fr, frontal 1-2: basal to apical; Frass, frontal association ctx; Par, parietal(1-4: basal to apical); ParTmp, parietotemporal; PrVis, primary visual ctx; SM, sensorimotor ctx; Th, thalamus; tmp, temporal ctx.