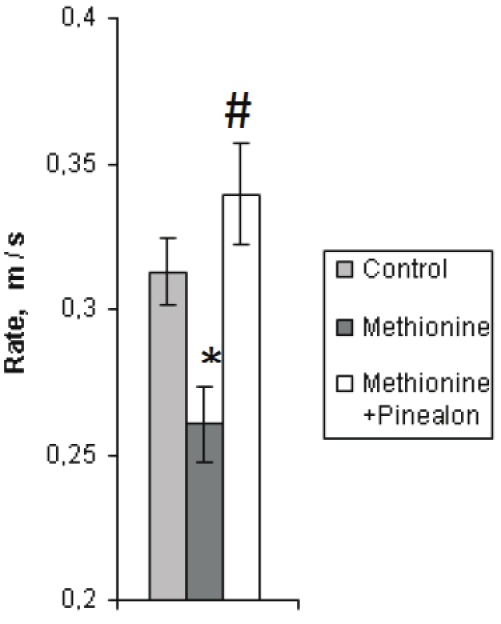
Figure 1.

Average swimming rate (m/s) during learning to find the platform by the animals from the three experimental groups (the first day of the experiment). Sign “*” corresponds to the statistically significant difference from intact group (p<0.05), “#” – to the statistically significant difference from methionine loaded group (p<0.05).
