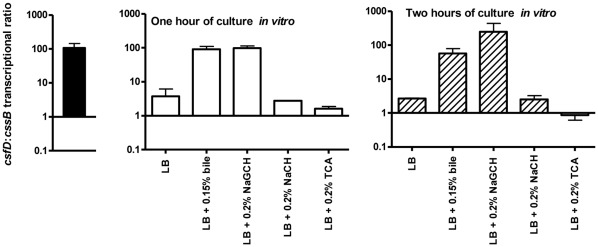
Figure 2. Transcriptional csfD:ccsB ratio in vivo and in vitro.
Transcription of csfD and cssB was quantified by real time reverse transcriptase PCR (rt RT-PCR) in in vivo bacterial samples (strains E1777, E1785, E2265; closed bar) and after one (strains E1785, E2265, E3003; open bars) and two (E1777, E1779; hatched bars) hours of in vitro culture in LB medium alone and in LB supplemented with 0.15% crude bile or 0.2% individual bile salts. Bars show the means and standard errors of the means of two (after two hours of culture) or three (in vivo and after one hour of culture) separate experiments.

