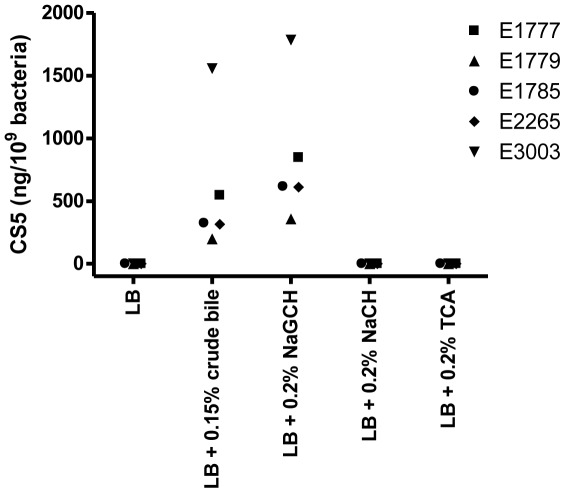
Figure 3. Phenotypic CS5 levels in LB alone and LB supplemented with bile or individual bile salts.
CS5 expression was quantified by inhibition ELISA after overnight culture to stationary phase of strains E1777, E1779, E1785, E2265, and E3003. CS5 surface expression tifwas induced by NaGCH, but not by the corresponding unconjugated bile salt NaCH or its tauro-conjugated counterpart TCA (representative data).

