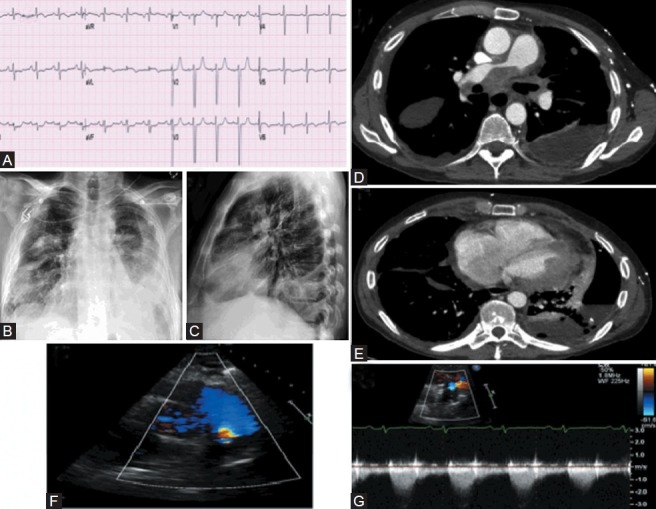
Figure 14.

Category 5 PH. (A) ECG showed non-specific TW flattening. (B, C) Chest X-ray showed left-sided pleural effusion. (D, E) CT scan showed extensive confluent mediastinal and bihilar lymphadenopathy, compressing both pulmonary arteries, right more so than left. The tumor was also seen around the pericardium. Left-sided pleural effusion is visualized. (F) Right ventricular outflow tract echocardiogram color flow view showing turbulence distal to the pulmonic valve. (G) Pulsed wave Doppler across stenosis showing flow acceleration, with flow of 2 m/s (compared with normal of 1 m/s).
