
Figure 2.
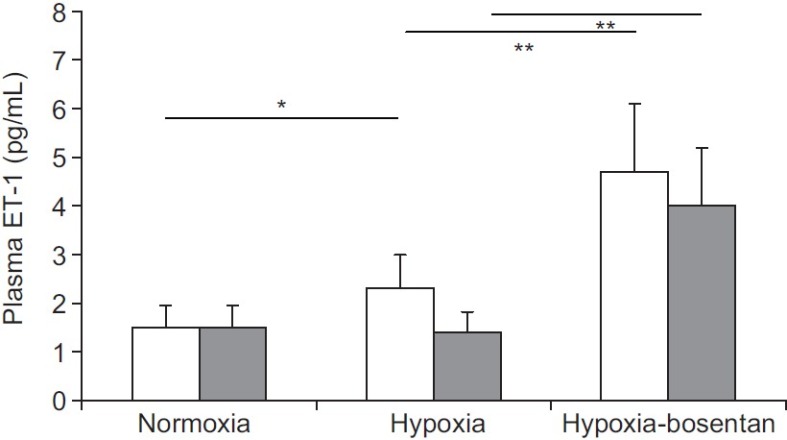
Plasma endothelin-1 (ET-1) concentrations in control (CS, open bar) and HAPE (HS, gray bar) subjects. *P=0.04; **P<0.01.
Official websites use .gov
A
.gov website belongs to an official
government organization in the United States.
Secure .gov websites use HTTPS
A lock (
) or https:// means you've safely
connected to the .gov website. Share sensitive
information only on official, secure websites.
Plasma endothelin-1 (ET-1) concentrations in control (CS, open bar) and HAPE (HS, gray bar) subjects. *P=0.04; **P<0.01.