
Figure 2.
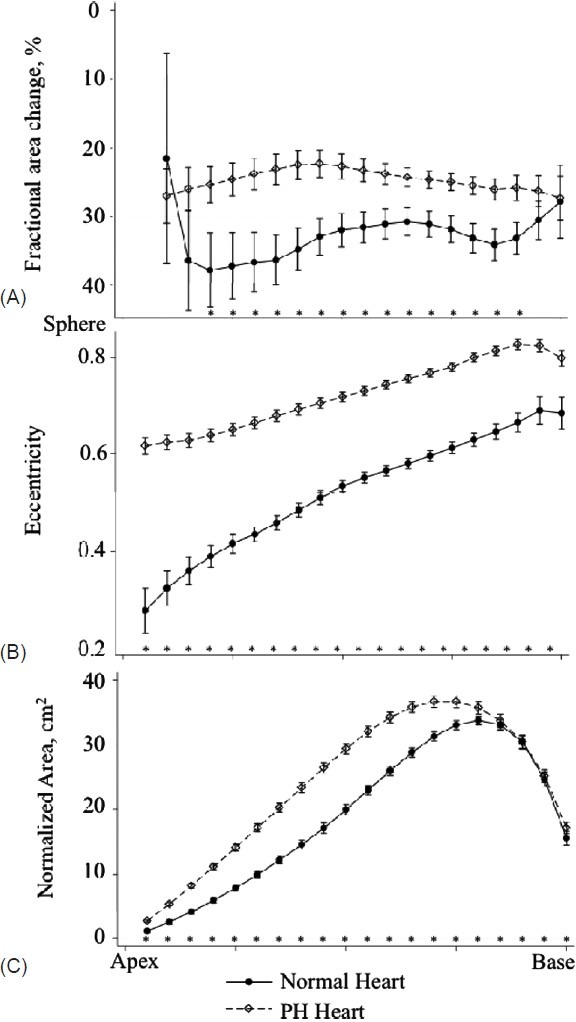
Fractional area change (A), eccentricity (B) and normalized area (C) in 20 short-axis slices from apex to base in normal and PH hearts. Significant differences by t-test for individual slices are noted on the figure (*, P<0.05).
Official websites use .gov
A
.gov website belongs to an official
government organization in the United States.
Secure .gov websites use HTTPS
A lock (
) or https:// means you've safely
connected to the .gov website. Share sensitive
information only on official, secure websites.
Fractional area change (A), eccentricity (B) and normalized area (C) in 20 short-axis slices from apex to base in normal and PH hearts. Significant differences by t-test for individual slices are noted on the figure (*, P<0.05).