
Figure 4.
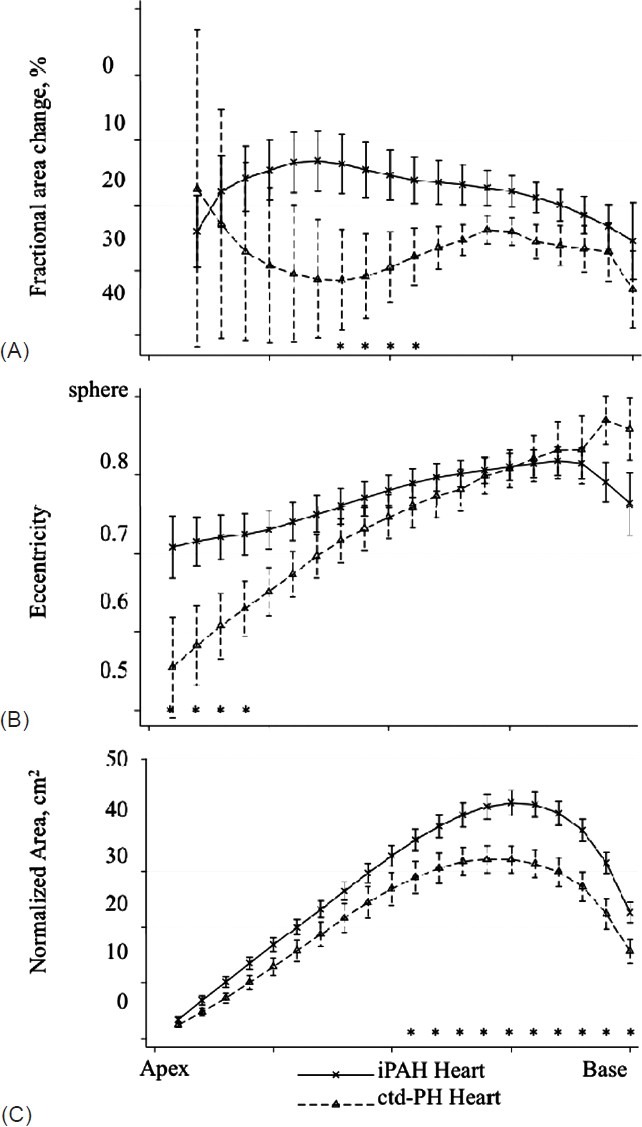
Fractional area change (A), eccentricity (B) and normalized area (C) in 20 short-axis slices from apex to base in the hearts of participants with iPAH or ctd-PH and TAPSE </= 18mm. Significant differences by t-test for individual slices are noted on the figure (*, P<0.05).