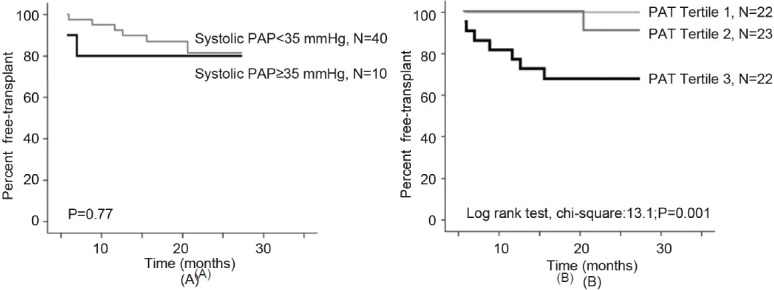
Figure 2.

Kaplan–Meier time to lung transplantation curves according to the level of systolic pulmonary arterial pressure (sPAP) (< or ≥ 35 mmHg) (A), and according to the tertile of pulmonary acceleration time (PAT), tertile 3 representing the lowest tertile, <101 ms (B). Time to lung transplantation was significantly shorter in the lowest PAT tertile compared to the two other tertiles (P<0.001) whereas no difference was observed according to the level of sPAP.
