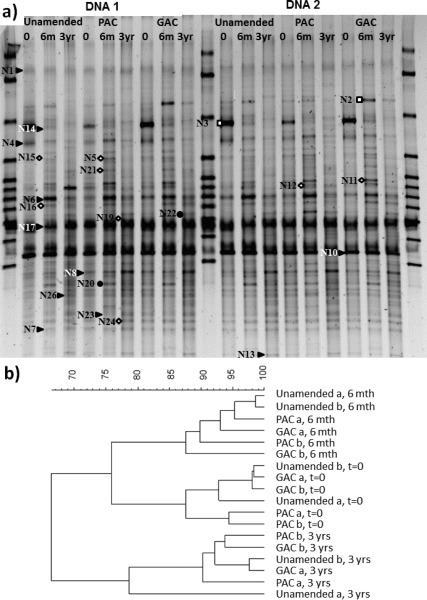
Figure 3.
(a) DGGE gel showing the location of excised bands with the correspondent affiliation to three classes of environmental bacteria (right solid triangle = actinobacteria; ◊ = proteobacteria; □ = bacteroidetes; ● = unknown). Closest matching sequences are reported in Table S1 in Supporting Information. DNA was extracted twice (DNA1 and DNA2) from the unamended and AC amended soils (PAC, GAC) at time zero, 6 months, and 3 years. (b) Dendrograms showing cluster analysis of the similarities (Pearson product moment correlation coefficient) between the different community compositions of the treatments over time, examined by DGGE.

