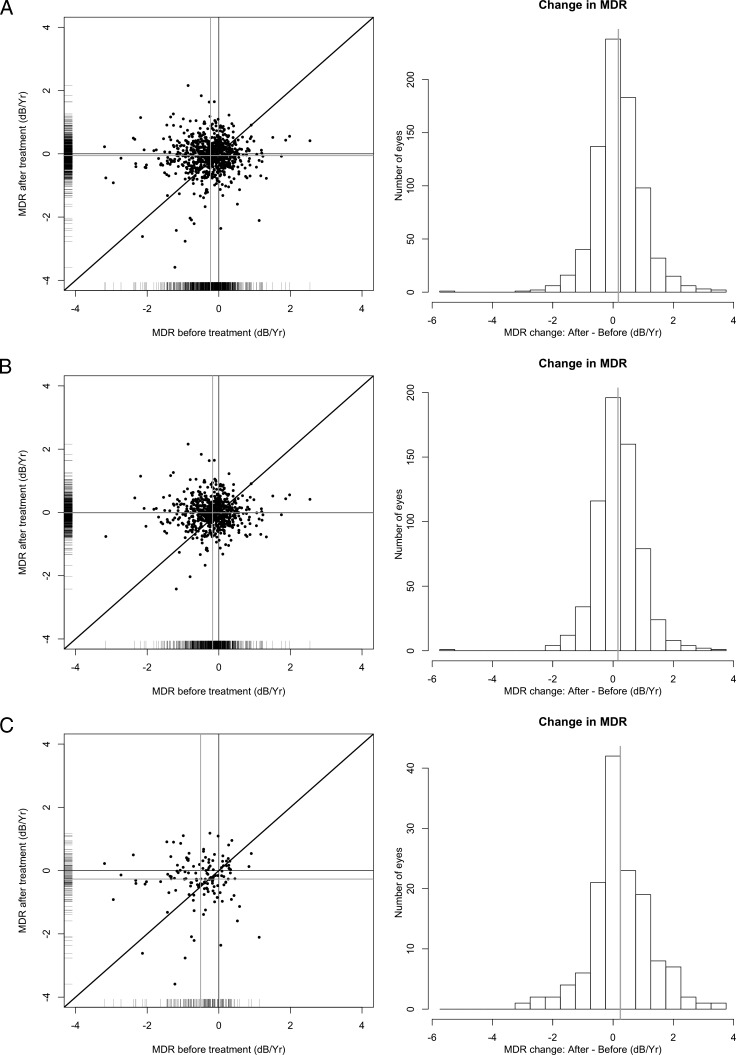
Figure 1.
Comparison of changes in MDRs before (x-axis) and after (y-axis) treatment. (A) All participants are included. (B) Only participants who did not reach a POAG endpoint are included. (C) Only participants who reached a POAG endpoint are included. The dark grey lines show flat slopes (0.0 dB/year) in both axes, and the light grey lines show the average change in MDR before and after treatment.

