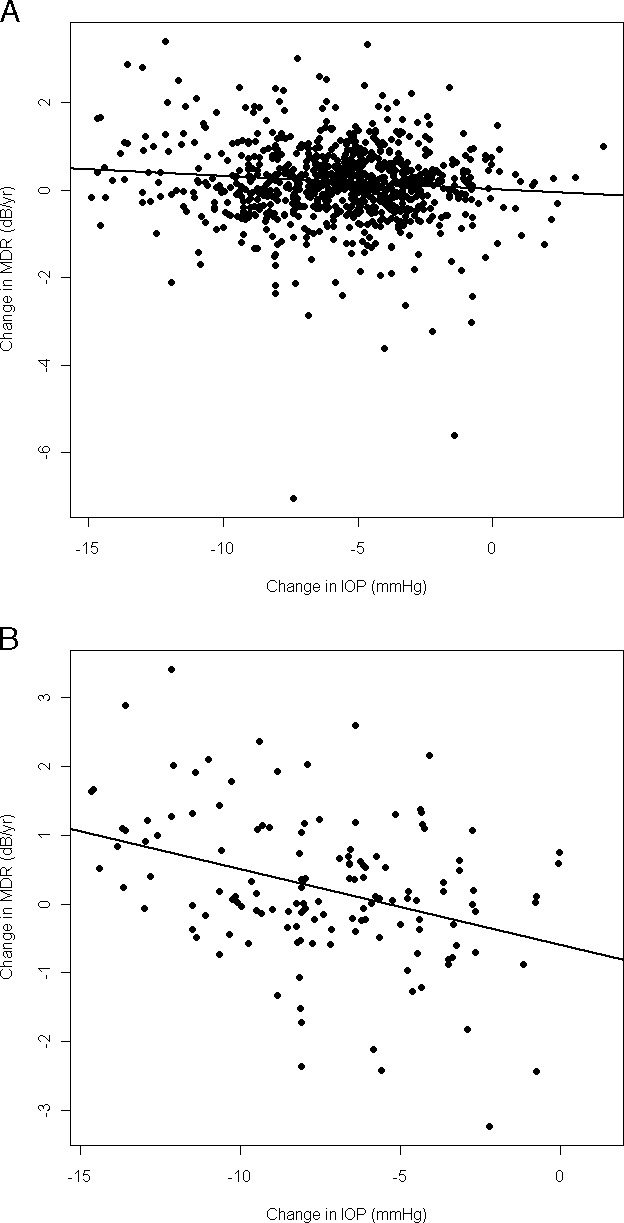
Figure 2.

Comparison between changes in absolute IOP (x-axis) and changes in MDRs of decline (y-axis) following treatment. The black line corresponds to the best-fit linear regression line. (A) All participants are included (P = 0.005). (B) Only participants who reached a POAG endpoint are included (P < 0.0001).
