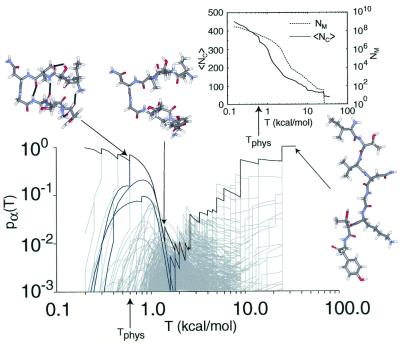
Figure 3.
Probability macrostate tree for BH8. The trajectories leading to PRSM members are highlighted. The peptide figures show the average macrostate conformations at three different temperatures on the trajectory that leads to the most probable macrostate (i.e., the native state). The PRSM trajectories are darkened. The inset plots the T-dependent number of macrostates NM(T) (Eq. 15) and the probability-weighted mean number of nonlocal atom pairs in contact 〈NC〉(T) (Eq. 14).

