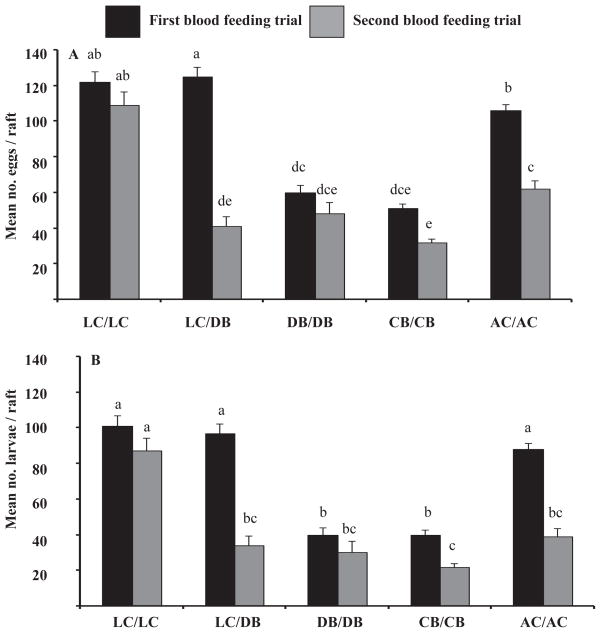
Figure 1.
The mean number of eggs/raft (i.e., fecundity) (± standard error) (A) and the mean number of larvae/raft (i.e., fertility) (± standard error) (B) in subsets for the first and second blood feeding trial in each treatment group. Groups with different lowercase letters are significantly different in each figure.

